Energy Monitoring System Project using IoT, ESP32 and PZEM-004T
Quick Answer
An Energy Monitoring System is an IoT-based project that measures voltage, current, power, energy units, and estimated electricity cost in real time. A student project usually uses ESP32, an energy sensor such as PZEM-004T, and a dashboard like Blynk, Firebase, or ThingsBoard to display live electricity usage, graphs, and alerts.
Introduction
Electricity consumption is increasing, energy bills are becoming harder to control, and smart monitoring is now a practical engineering problem. For final-year students, this makes the Energy Monitoring System project a strong IoT project because it combines embedded systems, sensors, cloud dashboards, billing logic, and real-time analytics.
India’s electricity context also makes the topic relevant. Government data shows India’s per-capita electricity consumption reached 1,460 kWh in 2024–25, which strengthens the need for smarter usage tracking and demand-side energy awareness.
By the end of this guide, you will know the components, working principle, circuit flow, formulas, dashboard setup, source code logic, testing method, report format, and viva points needed to present this project confidently.
What Is an Energy Monitoring System?
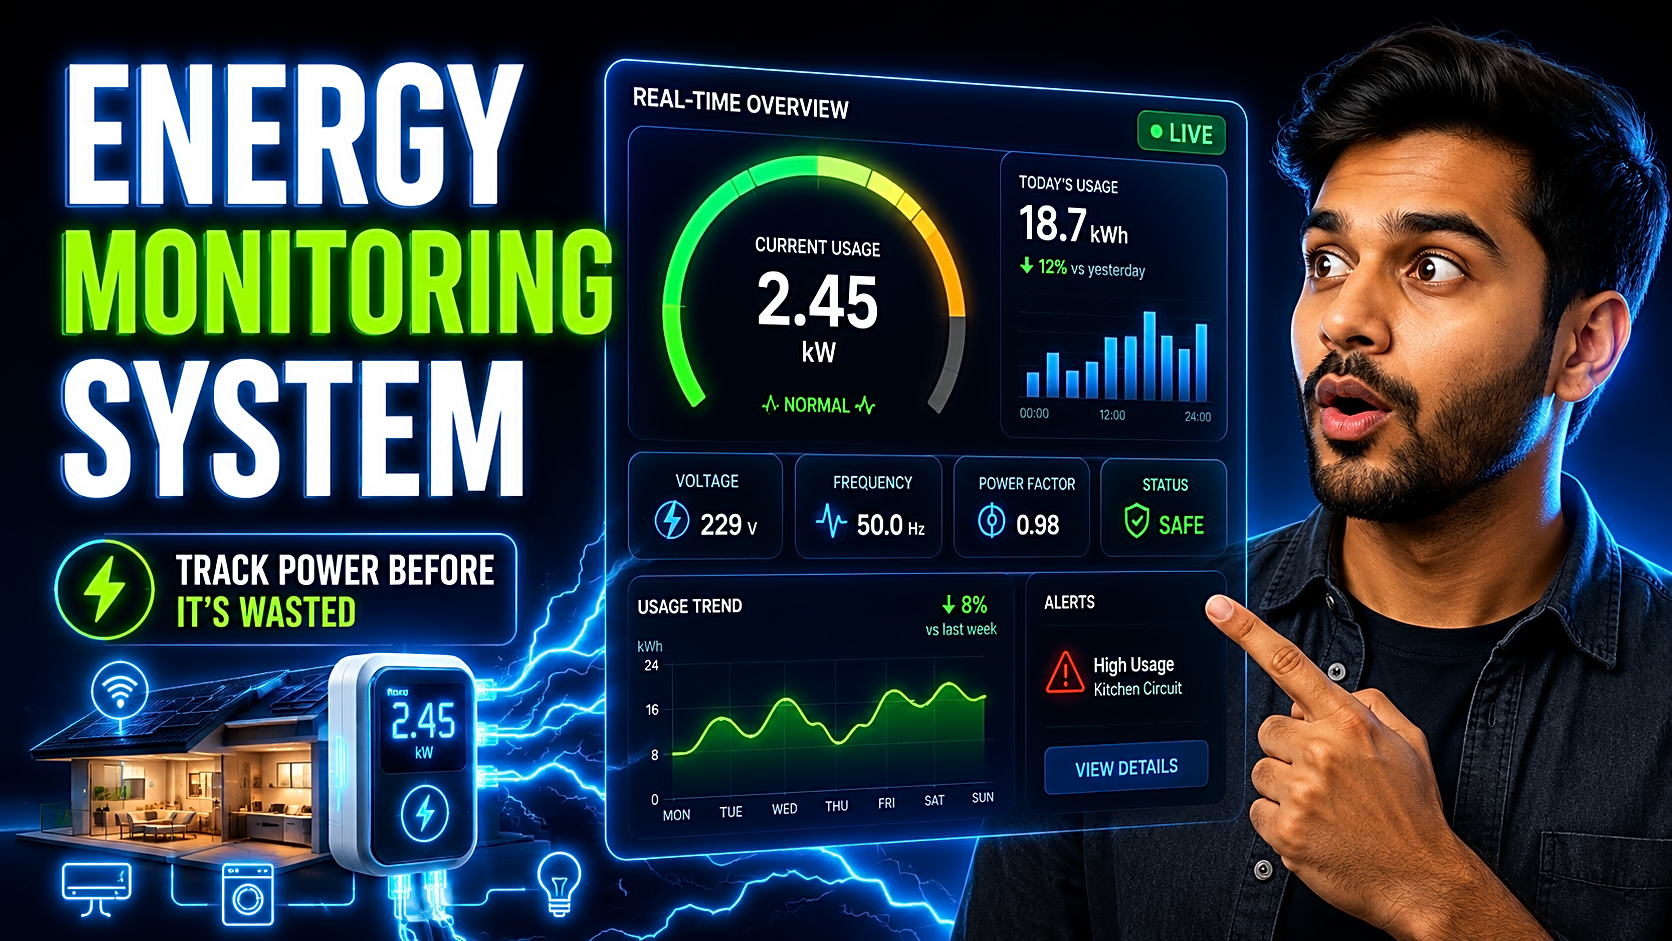
An Energy Monitoring System is a smart system that tracks electricity usage in real time. Instead of waiting for a monthly bill, users can monitor how much power is being consumed by an appliance, room, lab, building, or machine.
A basic energy monitoring system measures:
- Voltage
- Current
- Power
- Energy consumption in kWh
- Estimated electricity cost
- Overload or abnormal usage alerts
An advanced IoT energy monitoring system can also include cloud storage, mobile notifications, historical graphs, relay-based load control, multi-load monitoring, solar monitoring, and predictive consumption analytics.
Why This Is a Good Final-Year Project
This project is ideal for engineering students because it is practical, explainable, and easy to expand. It demonstrates:
- IoT device communication
- Sensor integration
- Real-time data collection
- Cloud dashboard development
- Electricity bill calculation
- Energy efficiency concepts
- Alert-based automation
- Testing and calibration
BEE describes Demand Side Management as a cost-effective customer strategy that encourages efficient end-use technologies and can reduce or shift electricity bills and peak demand, which makes this project highly relevant to real-world energy management.
Components Required for Energy Monitoring System
|
Component |
Purpose |
Recommended Option |
|
Microcontroller |
Reads sensor data and sends it to cloud |
ESP32 |
|
Energy meter sensor |
Measures voltage, current, power, kWh |
PZEM-004T |
|
Current sensor |
Measures load current |
ACS712 or CT sensor |
|
Voltage sensor |
Measures AC voltage |
ZMPT101B |
|
Dashboard |
Shows live data and graphs |
Blynk, Firebase, ThingsBoard |
|
Display |
Shows local readings |
OLED or 16x2 LCD |
|
Relay module |
Optional load control |
5V relay |
|
Power supply |
Powers controller |
5V adapter |
|
Demo load |
Testing appliance |
Bulb or low-power load |
Recommended student setup: Use ESP32 + PZEM-004T + Blynk/Firebase dashboard. ESP32 is suitable because it supports Wi-Fi and Bluetooth connectivity, and Espressif documents ESP32 as a Wi-Fi-and-Bluetooth SoC.
ESP32 + PZEM-004T Wiring Table
|
PZEM-004T Pin |
ESP32 Connection |
Purpose |
|
VCC |
5V |
Module power |
|
GND |
GND |
Common ground |
|
TX |
ESP32 RX pin |
Sends readings to ESP32 |
|
RX |
ESP32 TX pin |
Receives commands from ESP32 |
|
AC input |
Load line connection |
Measures AC voltage |
|
CT clamp |
Around live wire only |
Measures current |
Safety warning: Do not handle 220V AC wiring without lab supervision. Use insulated wires, proper enclosure, MCB/fuse protection, and a low-power demo load during testing.
Working Principle of Energy Monitoring System
The working flow is simple:
- The sensor measures voltage and current from the connected load.
- ESP32 reads sensor values through UART/serial communication.
- The system calculates power, energy units, and estimated cost.
- ESP32 sends readings to a cloud dashboard using Wi-Fi.
- The dashboard displays live voltage, current, power, kWh, and bill estimate.
- If usage crosses a threshold, the system triggers an alert.
In an ESP32 + PZEM-004T setup, the PZEM module handles AC electrical parameter measurement, while ESP32 handles data processing, Wi-Fi communication, and dashboard updates.
Formula Section: Power, Energy and Bill Calculation
|
Metric |
Formula |
Meaning |
|
Power |
Voltage × Current × Power Factor |
Real power in watts |
|
Energy |
Power × Time / 1000 |
Units consumed in kWh |
|
Bill |
kWh × Tariff Rate |
Estimated electricity cost |
|
Alert |
Power > Threshold |
High-load warning |
Example: If a 100W bulb runs for 5 hours:
Energy = 100 × 5 / 1000 = 0.5 kWh
If tariff = ₹8 per unit, estimated bill = 0.5 × 8 = ₹4
This billing feature makes the project more practical and easier to explain during viva.
Dashboard Options: Firebase vs Blynk vs ThingsBoard
|
Dashboard |
Best For |
Advantage |
Limitation |
|
Blynk |
Beginner IoT demo |
Fast mobile dashboard setup |
Limited customization |
|
Firebase |
Web/mobile app data sync |
Good for custom apps |
Needs database setup |
|
ThingsBoard |
Advanced IoT dashboard |
MQTT, widgets, analytics |
More setup effort |
For most students, Blynk is easiest, Firebase is best for custom app projects, and ThingsBoard is best for advanced IoT explanation using MQTT.
Source Code Flow for Energy Monitoring System
Use this logic in your Arduino IDE or ESP-IDF implementation:
Start
Initialize serial monitor
Initialize ESP32 Wi-Fi
Initialize PZEM-004T sensor
Connect to Blynk/Firebase/ThingsBoard
Loop:
Read voltage
Read current
Read power
Read energy in kWh
Calculate estimated bill
Send data to dashboard
Display values on OLED/LCD
If power exceeds threshold:
Trigger alert
Send notification
Wait for update interval
Repeat
Important code modules:
- Wi-Fi connection module
- Sensor reading module
- kWh calculation module
- Dashboard upload module
- Alert module
- Reconnection logic
If Wi-Fi disconnects, the ESP32 should retry connection instead of stopping the system.
Step-by-Step Implementation Guide
Step 1: Define the Scope
Decide whether you want to monitor one appliance, one room, or multiple loads. For final-year submission, start with one load and later expand to multi-load monitoring.
Step 2: Select Hardware
Use ESP32, PZEM-004T, OLED/LCD display, jumper wires, a 5V adapter, and a safe demo load. Use a proper enclosure if you are showing a physical prototype.
Step 3: Build the Circuit
Connect PZEM-004T to ESP32 using UART pins. Place the CT clamp around the live wire only. Do not place both live and neutral wires inside the same CT clamp because it can cancel the reading.
Step 4: Upload the Code
Program ESP32 to read voltage, current, power, and energy. Add dashboard credentials and test values on the serial monitor before connecting the full dashboard.
Step 5: Create the Dashboard
Create widgets for:
- Voltage
- Current
- Power
- Energy units
- Estimated bill
- Daily usage graph
- Alert status
Step 6: Add Alerts
Set a maximum power threshold. If consumption crosses the limit, trigger a buzzer, dashboard notification, or mobile alert.
Step 7: Test and Calibrate
Compare readings with a standard meter. If the values are unstable, check wiring, sensor calibration, load rating, and power supply quality.
Step 8: Prepare the Project Report
Include abstract, introduction, objectives, existing system, proposed system, circuit diagram, block diagram, algorithm, hardware/software requirements, testing table, results, screenshots, conclusion, and future scope.
For documentation support, students can use a B.Tech final year project report format with diagrams, test cases, screenshots, and synopsis. FileMakr’s B.Tech report page highlights IEEE-ready PDFs, diagrams, test cases, PPT, and synopsis support.
Testing and Troubleshooting Table
|
Test Case |
Expected Result |
Troubleshooting Tip |
|
Voltage reading |
Voltage appears on dashboard |
Check AC input and PZEM wiring |
|
Current reading |
Current increases when load is ON |
Check CT clamp placement |
|
Power calculation |
Watt value updates |
Check voltage/current values |
|
kWh reading |
Energy increases over time |
Run load for fixed duration |
|
Dashboard sync |
Data updates live |
Check Wi-Fi and API token |
|
Alert logic |
Notification triggers |
Check threshold condition |
|
Restart test |
ESP32 reconnects |
Add reconnection logic |
Viva Questions and Answers
1. What is kWh?
kWh means kilowatt-hour. It is the unit used to measure electrical energy consumption.
2. Why use ESP32?
ESP32 has built-in Wi-Fi, enough GPIO pins, strong IoT support, and better performance than Arduino UNO for cloud-based projects.
3. What is PZEM-004T?
It is an energy meter module used to measure voltage, current, power, energy, frequency, and power factor.
4. What is MQTT?
MQTT is a lightweight messaging protocol used in IoT systems to send sensor data efficiently.
5. Why is calibration needed?
Calibration improves accuracy by comparing sensor readings with a standard meter and correcting errors.
6. What happens if Wi-Fi disconnects?
The system should retry the connection and continue local monitoring until the dashboard reconnects.
Future Enhancements
You can upgrade this project by adding:
- Multi-load monitoring
- Solar energy monitoring
- Relay-based automatic load control
- Daily, weekly, and monthly graphs
- Appliance-level energy tracking
- AI-based consumption forecasting
- Electricity theft detection
- Home Assistant or Node-RED integration
Conclusion
An Energy Monitoring System project using IoT and ESP32 is a strong final-year project because it solves a real problem: monitoring and reducing electricity consumption. It combines embedded systems, sensors, real-time dashboards, kWh calculation, billing logic, and alert-based automation.
For the best result, build the basic system first using ESP32, PZEM-004T, and a real-time dashboard. Then improve it with bill calculation, alerts, calibration, report screenshots, and viva-ready explanations.
Need project files faster? Explore FileMakr’s final year project source code and live demo for final year projects to compare working flows before final submission. FileMakr’s homepage and source-code page position the platform around project reports, source code, live demos, and setup support for final-year students.