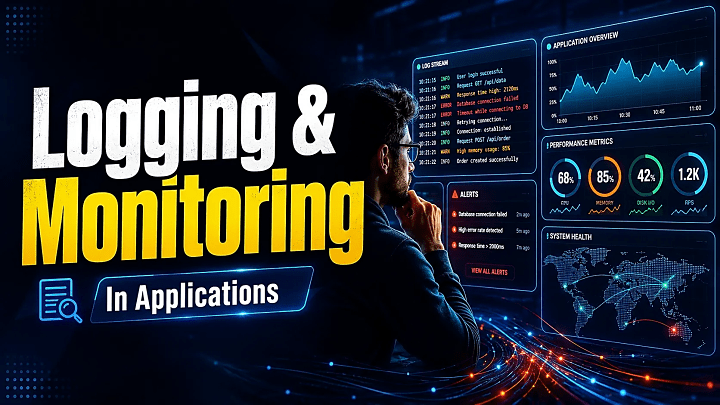
: What Are Application Logging and Monitoring?
Application logging records meaningful events produced while software is running, including requests, validation failures, authentication attempts, database errors, and important business actions.
Application monitoring continuously evaluates application health and performance using metrics, health checks, dashboards, and alert rules.
A complete setup combines:
- Logs to explain what happened
- Metrics to reveal trends and abnormal behaviour
- Traces to follow a request through multiple components
- Profiles to show where code consumes CPU, memory, or execution time
- Alerts to notify the team when a defined condition requires action
OpenTelemetry treats logs, metrics, traces, baggage, and profiles as related telemetry signals. These signals become more useful when they share request and execution context.
What Is Application Logging?
Application logging creates a chronological record of significant runtime events.
A useful structured log contains stable, searchable fields:
{
"timestamp": "2026-07-23T14:20:15Z",
"level": "ERROR",
"event": "payment_gateway_timeout",
"environment": "production",
"request_id": "req_8f31",
"component": "checkout-service",
"duration_ms": 5021,
"message": "Payment provider did not respond within the timeout"
}
This entry is more useful than a vague message such as Something went wrong.
A team can filter all payment timeouts, group failures by component, calculate their frequency, or follow one request using its correlation ID. Microsoft’s current monitoring guidance similarly recommends structured logs containing source, timing, and contextual information.
Common log levels include:
- DEBUG: Detailed development information
- INFO: Important normal events
- WARN: Recoverable abnormal conditions
- ERROR: Failed operations
- CRITICAL: Failures threatening overall availability
Production applications should not leave verbose debugging enabled permanently. Excessive logs increase noise, storage costs, and the chance of collecting unnecessary data.
What Is Application Monitoring?
Monitoring converts application behaviour into measurable indicators.
Instead of reading every log manually, the team tracks conditions such as:
- Request volume
- Error rate
- Response-time percentiles
- Service availability
- CPU and memory usage
- Database connection failures
- Queue length
- Background-job completion
- Successful orders, uploads, or predictions
Monitoring answers questions such as:
- Is the application available?
- Are server errors increasing?
- Has p95 response time crossed two seconds?
- Is memory consumption growing continuously?
- Did the scheduled report-generation job stop?
AWS distinguishes application logging—the collection of application events—from continuous monitoring of application health and performance.
Monitoring vs Observability
Monitoring and observability are related but not identical.
Monitoring checks known conditions. You define metrics, thresholds, dashboards, and alerts in advance.
Observability helps investigate system behaviour, including failures the team did not predict when configuring the dashboard.
For example:
- Monitoring reports that checkout errors increased.
- A trace shows that most failed requests waited on the payment service.
- Correlated logs reveal a repeated gateway timeout.
- Profiling may show that another endpoint is consuming excessive CPU.
Monitoring tells the team that a known symptom exists. Observability provides enough connected evidence to investigate why it exists.
Logs vs Metrics vs Traces vs Profiles
|
Concept |
Main Question |
Typical Data |
Best Use |
|
Logs |
What happened? |
Events, errors, context |
Debugging and audits |
|
Metrics |
Is behaviour changing? |
Counters, gauges, histograms |
Trends and alerts |
|
Traces |
Where did time or failure occur? |
Requests, spans, dependencies |
Distributed diagnosis |
|
Profiles |
Which code consumes resources? |
CPU, memory, stack samples |
Performance optimization |
|
Monitoring |
Does someone need to act? |
Rules applied to telemetry |
Detection and response |
These concepts should be correlated rather than operated as isolated dashboards.
Why Logging and Monitoring Matter for Final-Year Projects
Student applications increasingly contain authentication, APIs, databases, file uploads, payment simulations, machine-learning models, notifications, and administrative dashboards.
A small observability layer helps a project team:
- Diagnose defects faster
- Demonstrate reliability during the viva
- Record security-sensitive events
- Measure API performance
- Produce dashboard and testing evidence
- Explain how the application would be maintained after deployment
- Connect monitoring with software testing and deployment practices
For an ML project, useful events may include the model version, inference duration, invalid upload type, confidence range, and prediction failure. Sensitive uploaded content should not be copied into logs.
What Should an Application Log?
Record events that help explain failures, protect the application, or verify important business actions.
Recommended events
- Application startup and shutdown
- Authentication and authorization failures
- Input-validation failures
- Unhandled exceptions
- Database and external-service errors
- Important create, update, and delete actions
- Configuration or deployment changes
- Background-job status
- Rate-limit events
- Administrative actions
- Security-relevant changes
Data that should not be logged
Do not store:
- Plain-text passwords
- Access or refresh tokens
- Private keys
- Session secrets
- Complete payment-card information
- Unnecessary personal information
- Sensitive uploaded documents
Untrusted input should be encoded or sanitized before it enters logs. OWASP recommends excluding secrets, protecting log integrity, and preventing attackers from injecting misleading entries into logging systems.
What Application Metrics Should You Monitor?
Use a framework instead of selecting random dashboard widgets.
|
Framework |
What to Measure |
Best For |
|
RED |
Rate, errors, duration |
APIs and request-driven services |
|
Golden signals |
Latency, traffic, errors, saturation |
Overall service reliability |
|
USE |
Utilization, saturation, errors |
CPU, memory, disks, and infrastructure |
|
Business health |
Successful orders, uploads, reports, predictions |
User journeys and project outcomes |
For a college application, start with:
- Availability
- Request rate
- Error rate
- p95 response time
- CPU and memory
- Database health
- Critical-process success rate
The average response time can hide a smaller group of very slow requests. p95 latency shows the value below which 95% of measured requests completed.
SLI, SLO, and error budget
An SLI is the measured indicator, such as successful-request percentage.
An SLO is the target, such as 99% successful requests during a demonstration period.
The error budget is the amount of unreliability the application can tolerate before the target is missed.
Student projects do not need enterprise-grade reliability contracts, but defining one measurable target makes the monitoring evidence more credible.
Choosing a Logging and Monitoring Stack
|
Project Type |
Recommended Starting Stack |
|
Small local project |
Framework logger, rotating JSON files, health endpoint |
|
Deployed monolith |
Structured logs, Prometheus, Grafana, centralized log storage |
|
MERN or API project |
Request IDs, Prometheus client, Grafana, Loki or Elastic |
|
Distributed application |
OpenTelemetry SDK and Collector with logs, metrics, and traces |
|
Cloud-hosted project |
Native cloud monitoring or OpenTelemetry export |
Prometheus is designed for instrumenting, collecting, querying, and alerting on metrics. Grafana provides dashboards, while Loki or the Elastic Stack can centralize logs. OpenTelemetry provides vendor-neutral instrumentation when telemetry may be exported to different backends.
Step-by-Step Implementation Guide
1. Define critical user journeys
List the operations that must work:
- Registration and login
- Checkout
- File upload
- Prediction
- Report generation
- Administrator approval
2. Create a logging standard
Use consistent fields:
timestamp, level, environment, event, request_id, component, message, and non-sensitive context.
Prefer stable event names such as login_failed and database_timeout.
3. Add correlation IDs
Generate a request ID when a request enters the application. Include it in every related log and pass it to downstream components.
4. Create health endpoints
Use separate endpoints where possible:
/health/live
/health/ready
/metrics
Liveness confirms that the process is running. Readiness confirms that it can serve requests and reach critical dependencies.
5. Expose useful metrics
Track request totals, error totals, duration histograms, database failures, dependency status, and important business outcomes.
Avoid high-cardinality labels such as unrestricted email addresses, complete URLs, or user-generated IDs.
6. Configure Prometheus
A minimal scrape configuration can look like:
scrape_configs:
- job_name: student-application
metrics_path: /metrics
static_configs:
- targets: ["localhost:5000"]
7. Build a focused Grafana dashboard
Include:
- Availability
- Request volume
- Error rate
- p95 latency
- CPU and memory
- Database health
- One critical business outcome
8. Add an actionable alert
groups:
- name: application-alerts
rules:
- alert: HighApplicationErrorRate
expr: |
sum(rate(http_requests_total{status=~"5.."}[5m]))
/
sum(rate(http_requests_total[5m])) > 0.05
for: 5m
labels:
severity: warning
annotations:
summary: "Application error rate is elevated"
description: "More than 5% of requests have failed for five minutes."
Adapt the threshold to traffic volume and acceptable reliability. Prometheus recommends keeping alerts actionable, focusing on symptoms, and avoiding notifications for conditions where no response is required.
Every important alert should have:
- An owner
- A severity
- An evaluation window
- A recovery condition
- A response action or runbook
9. Test realistic failures
Stop the database, use an invalid external API key, trigger a validation failure, or make a dependency unavailable.
Confirm that:
- A meaningful log is created
- The relevant metric changes
- The dashboard displays the effect
- The alert fires after its evaluation window
- The request ID connects the evidence
10. Walk through the incident
A useful demonstration might follow this sequence:
- Checkout errors increase.
- The error-rate alert fires.
- Grafana shows rising p95 latency.
- A trace identifies the payment dependency.
- Correlated logs show repeated timeouts.
- The team corrects the timeout or dependency configuration.
- Metrics return to the expected range.
- The incident is documented in the project report.
Advanced Logging and Monitoring Tips
- Sample high-volume telemetry instead of storing everything.
- Set retention periods according to diagnostic and security needs.
- Separate operational logs from tamper-resistant audit records.
- Monitor browser errors and mobile crashes where the client matters.
- Use synthetic checks to test critical flows periodically.
- Avoid excessive metric-label cardinality.
- Review alerts that fire repeatedly without leading to action.
- Measure user outcomes, not only CPU and memory.
Final-Year Project Evidence Checklist
Include the following in the report and viva:
- Logging and monitoring architecture
- Sample structured log
- Metric definitions
- Dashboard screenshot
- Alert rule
- Failure-test procedure
- Root-cause investigation
- Data-protection controls
- SLI and SLO
- Known limitations
- Tool versions and test date
Building a deployable college application? Explore FileMakr’s final-year project source code for working frontend, backend, database, and setup guidance.
Frequently Asked Questions
What is the difference between logging and monitoring?
Logging records detailed events. Monitoring evaluates application health using telemetry, dashboards, thresholds, and alerts.
What is structured logging?
Structured logging stores events as named fields—commonly JSON—so they can be searched, filtered, aggregated, and correlated.
What is the difference between monitoring and observability?
Monitoring detects predefined conditions. Observability provides connected telemetry that helps investigate both expected and unexpected system behaviour.
How do correlation IDs work?
A unique ID is assigned to an incoming request and included in every related log or trace so the complete transaction can be reconstructed.
Which metrics should a small application monitor first?
Start with availability, request rate, error rate, p95 latency, CPU, memory, database health, and the success rate of one critical user journey.
Are Prometheus and Grafana enough?
They provide a strong metrics, dashboard, and alerting workflow. Centralized logs and traces may still be needed for deeper diagnosis.
How long should logs be retained?
There is no universal period. Base retention on diagnostic value, storage cost, security requirements, privacy obligations, and the project’s operational period.
Do small applications need distributed tracing?
A monolith may not need it initially. Tracing becomes more useful when a request crosses several services, queues, databases, or external APIs.
Conclusion
Application logging and monitoring should be designed with the application, not added only after it fails.
Begin with critical user journeys, structured logs, sensible log levels, health checks, and a few meaningful metrics. Add a focused dashboard, an actionable alert, and one realistic failure test.
For a final-year project, the best setup is not the one containing the most tools. It is the one the team can operate, test, explain, and defend with evidence.
For a more editorial Medium presentation, retain the JSON and alert examples but move the Prometheus scrape configuration into a short expandable appendix.